Reports — UX Mockup
A UX mockup of the planned Reports section of PPMS. It illustrates the proposed layout, navigation, and chart treatments for spend reporting across cost centres (vessels and sites) and the 3-level accounting-code hierarchy.
This is a non-functional mockup. All figures, vessel names, and accounting codes are illustrative sample data generated in the browser — not real spend. It exists to align on UX before implementation; nothing here is wired to the database. The live, clickable version is the standalone file
reports-mockup.html(see Interactive version below).
✅ Implementation status (shipped)
The core of this mockup is now implemented under Reports → Purchasing in the live app, wired to real approved-PO spend (not the sample data below):
- Cost Centres (
/reports/cost-centres) and Accounting Codes (/reports/accounting-codes), each with an index, drill-down, and detail view. - Filters: Granularity (Weekly / Monthly / Yearly), Financial Year, Show (Top 5 / Top 10 / Bottom 5 / All) — all URL-driven, so views are shareable/bookmarkable.
- KPI tiles, multi-series comparison charts, single-series trend charts, Top-N breakdowns (re-pivotable by tier / cost-centre / sub-account), per-row trend sparklines, and CSV export.
- Gated by the
view_analyticspermission (Manager / SuperUser / Auditor / Admin). Cost centres are vessels (the PO cost centre); sites are not cost centres.
Now fully implemented, including the pieces deferred in the first pass: the Weekly granularity (focuses one FY month, buckets by week-of-month, with a Month picker), the “Add to graph” custom multi-select comparison (tick rows → compare just the selected set, via a shareable ?sel=…&cmp=1 URL), and line-item-level account allocation (a multi-account PO is split proportionally across its line-item accounting codes, so the accounting-code report attributes it correctly).
Code: App/lib/reports.ts (aggregation core + unit tests), App/app/(portal)/reports/** (pages), App/components/reports/** (toolbar + charts), App/app/api/reports/spend/ (CSV export).
Shared shell
Every report screen uses the same frame: the PPMS sidebar, a breadcrumb header, and a pinned filter toolbar offering Granularity (Yearly / Monthly / Weekly), Financial Year, and a Show scope (Top 5 / Top 10 / Bottom 5 / All). Filters persist as you move between the index and detail views.
Cost Centres — comparison (monthly)
The landing view. Compares spend across cost centres for the selected period, with KPI tiles (total spend, count, highest spender, YoY change), a multi-line comparison chart, and a sortable table with per-row trend sparklines. Each row links to that cost centre's report; rows can be ticked and sent to a custom graph.

Cost Centres — year-over-year (yearly)
Switching Granularity to Yearly swaps the period filter for a financial-year scope and recasts the comparison as year-over-year bars across the available financial years.

Cost Centre report (detail)
Clicking a cost centre opens its report: period KPIs, a spend-trend chart, and a Top accounting codes breakdown that can be re-pivoted by tier (Heading / Sub-heading / Leaf) and Top-N.

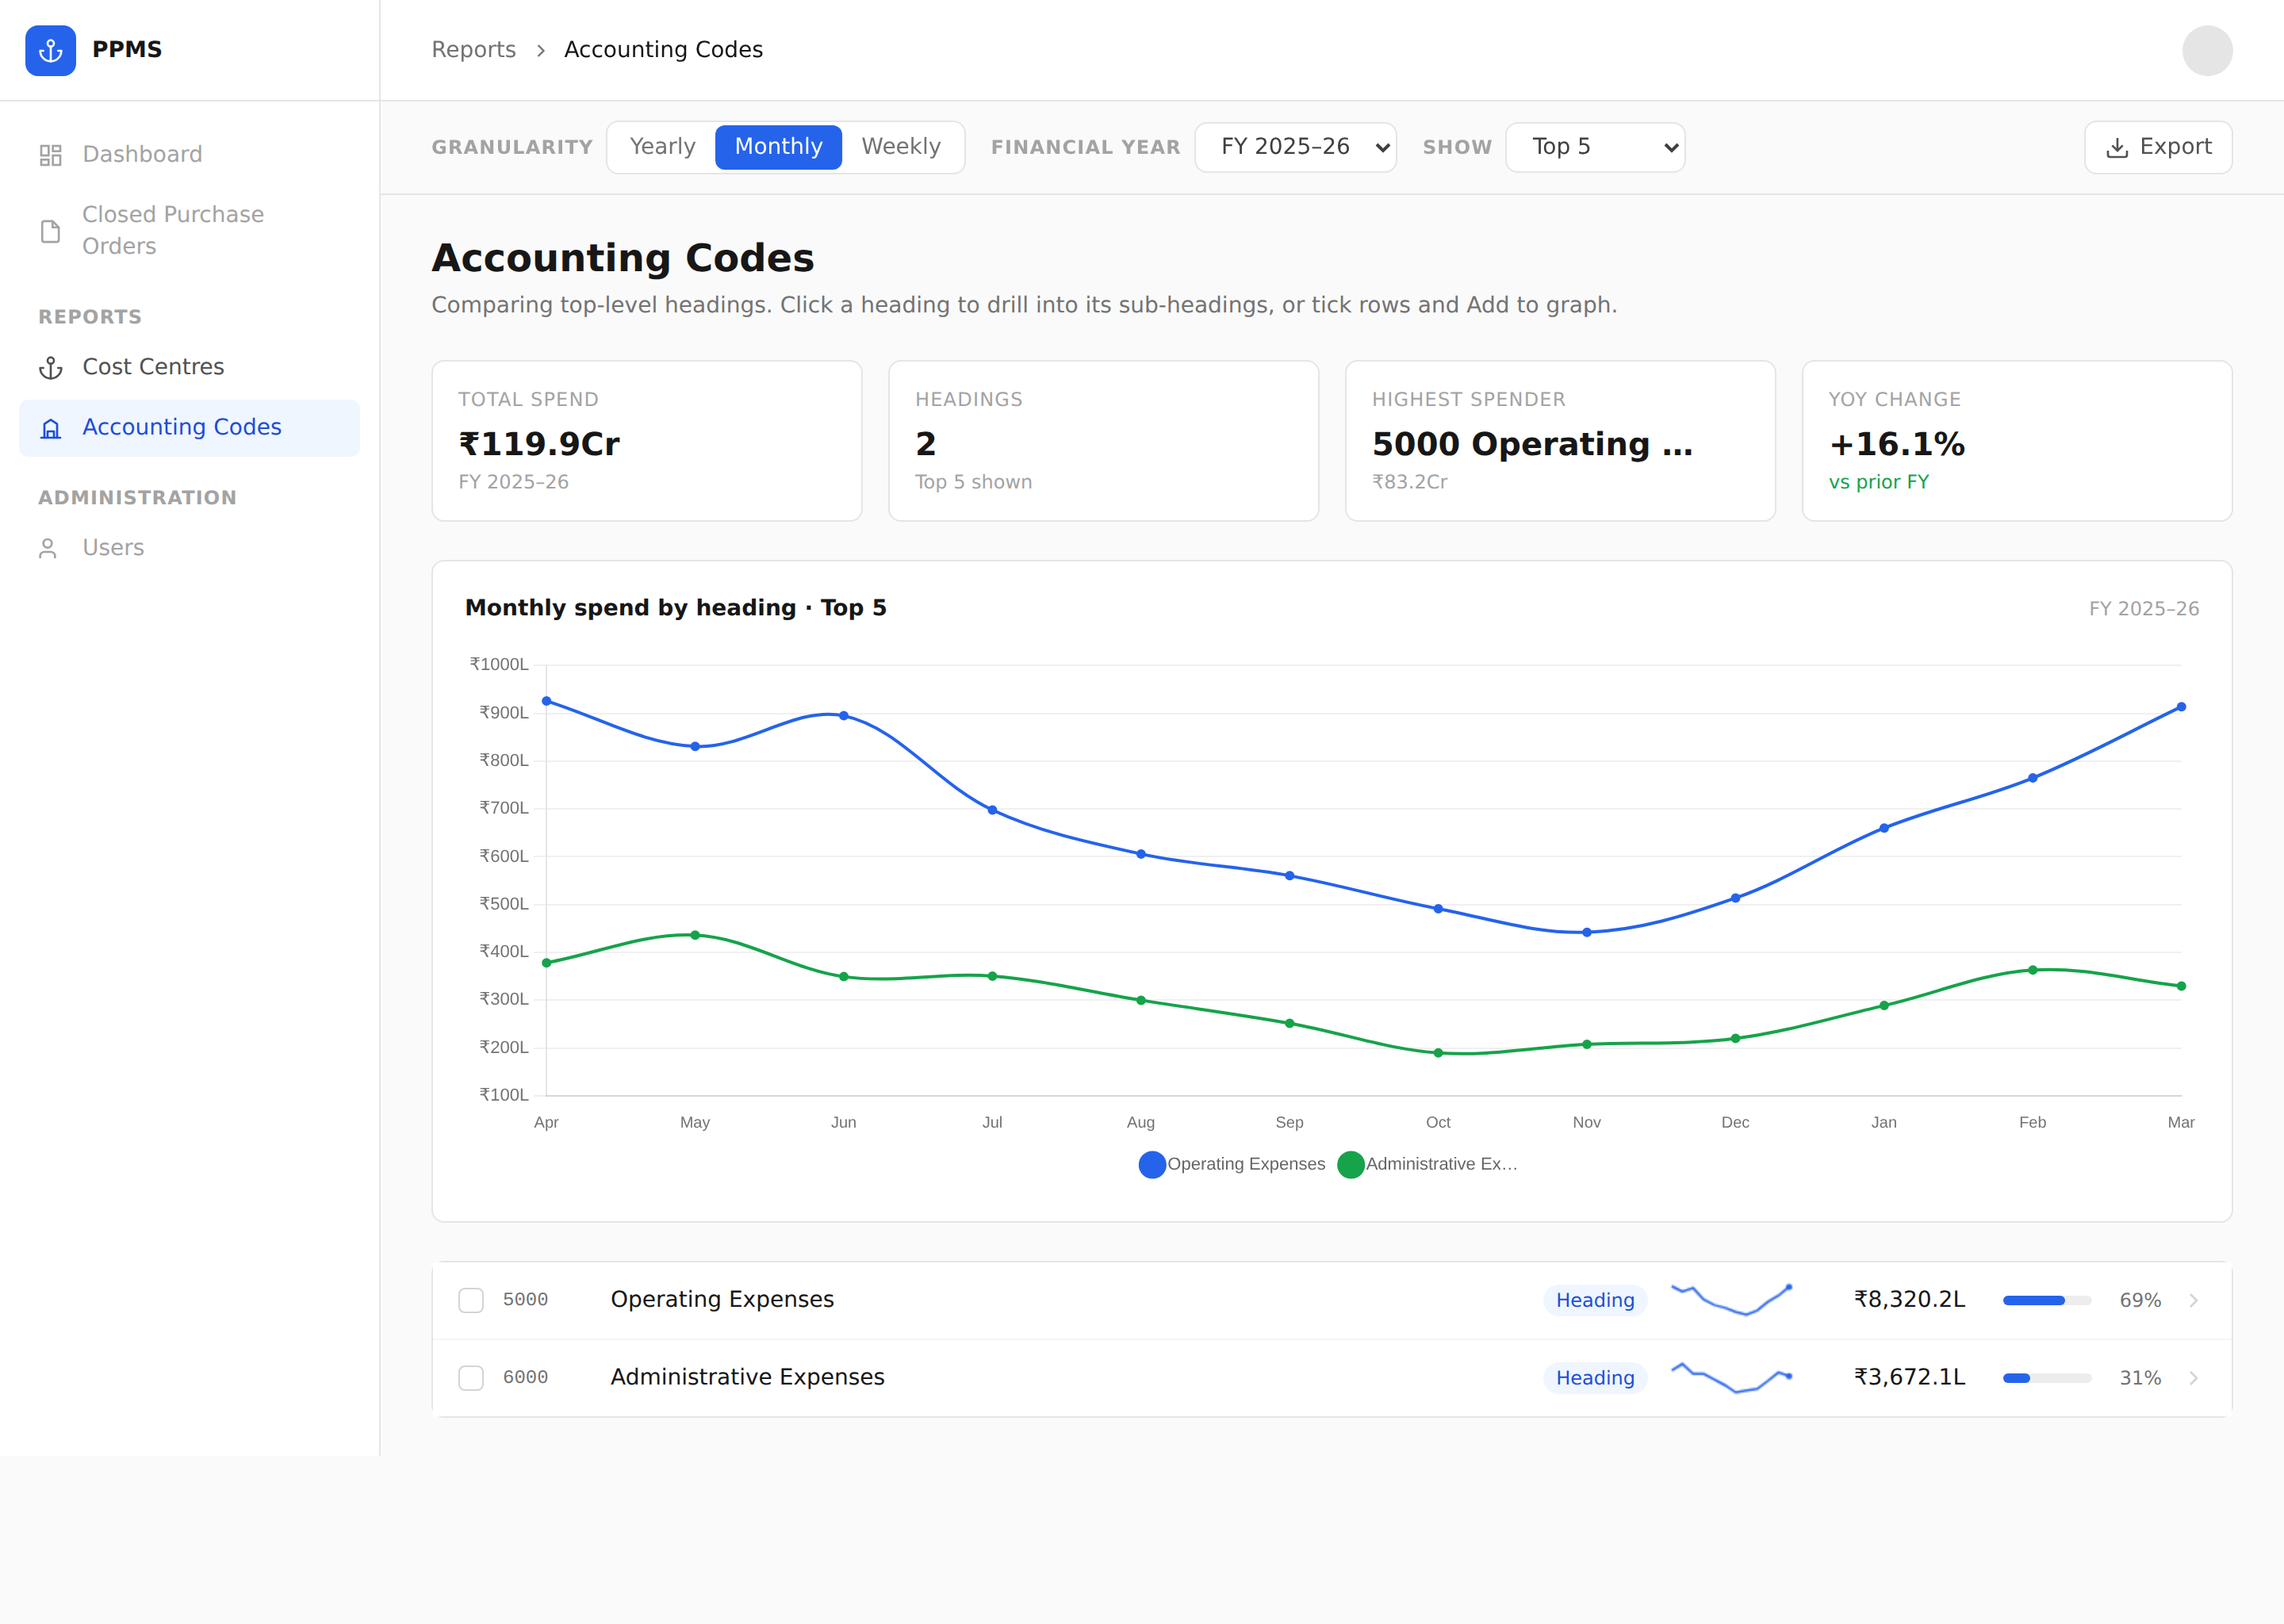
Accounting Codes — headings
The Accounting Codes section mirrors the same shell but is driven by the chart of accounts. The top level compares the tier-1 headings.
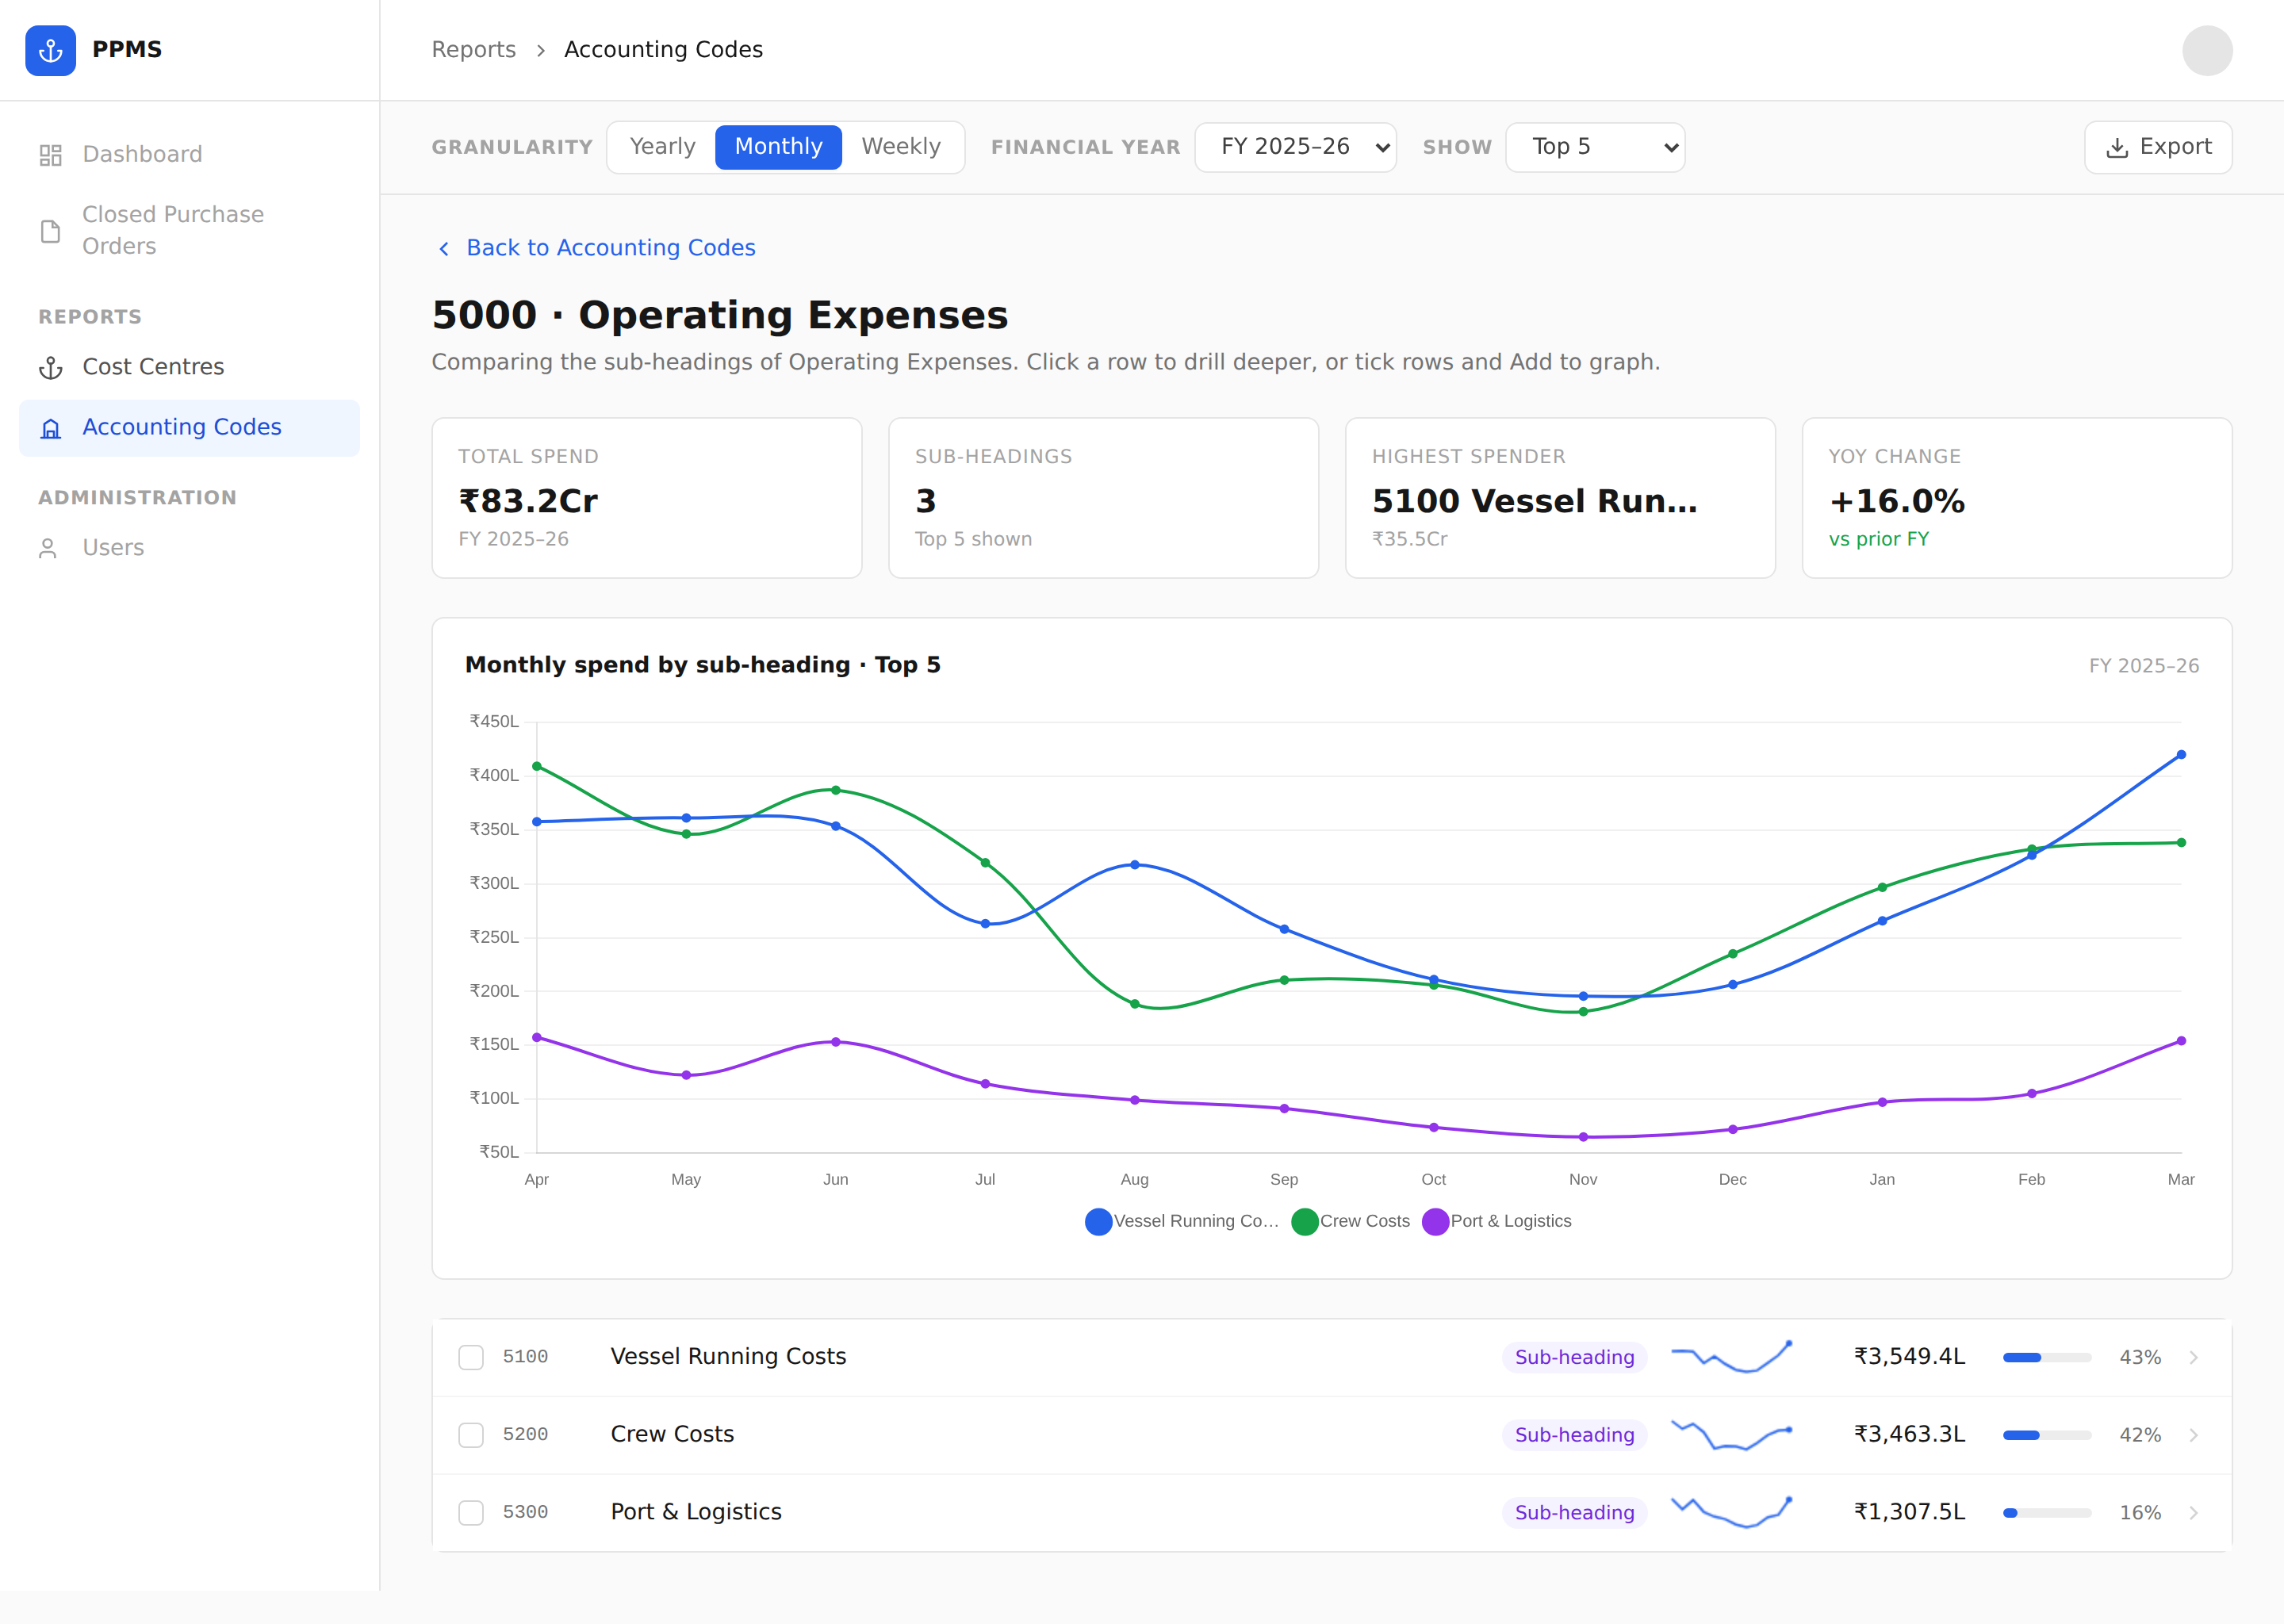
Accounting Codes — drill-down
Clicking a heading drills into its sub-headings (and, one level deeper, its leaf codes), keeping a Back trail. The comparison chart and table re-scope to the current level.
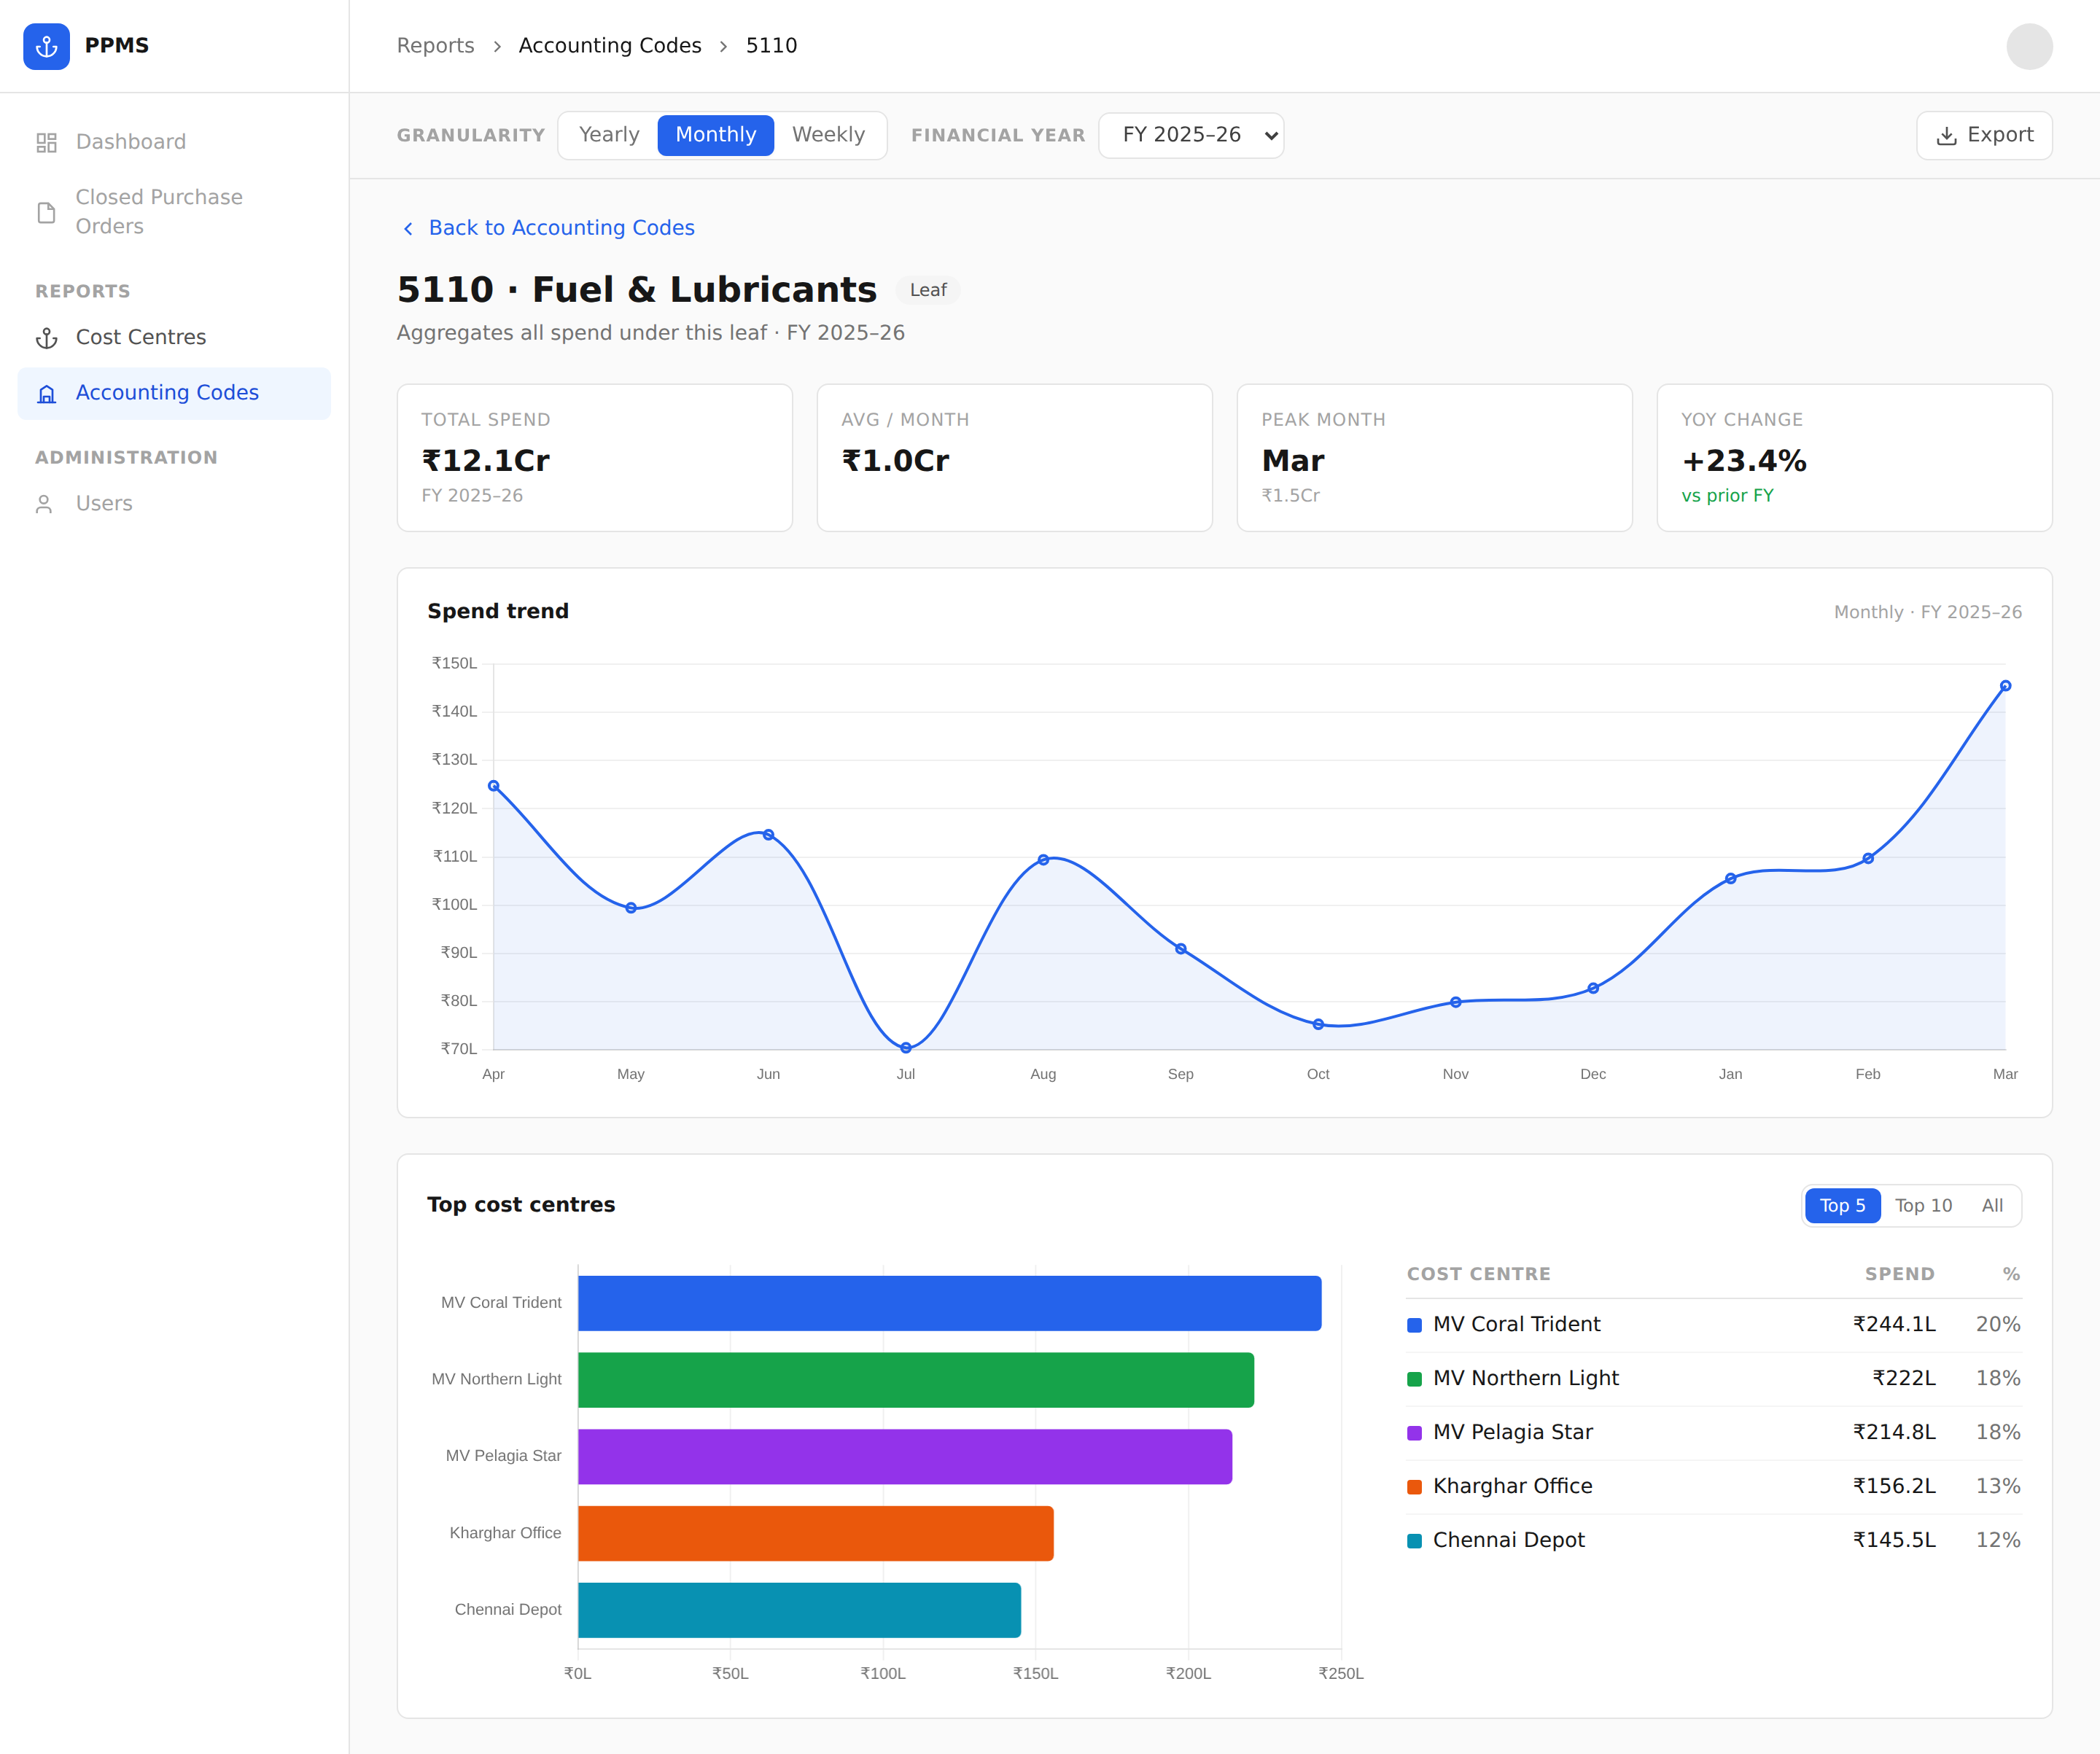
Accounting-code report (leaf)
A leaf code opens its own report — the same detail layout as a cost centre, but broken down by cost centre instead of by code, showing which vessels/sites drive spend on that line.
Interactive version
The screenshots above are static. The fully clickable mockup lives in
reports-mockup.html. Because the Forgejo wiki renders Markdown and sanitises
embedded HTML/scripts, it will not run the mockup inline — open the file
locally in a browser, or host it somewhere that serves HTML (Forgejo/Codeberg
Pages, any static host) and link it here.
Mockup screenshots regenerated from reports-mockup.html. To refresh them
after a mockup change, re-run the capture and overwrite the files under
images/reports-mockup/.